To keep services business growing profitably, companies need a culture of continuously monitoring and optimizing their financial and operational data. By having a constant pulse, they can gain invaluable insights into their business health and overall performance. This practice enables the identification of potential areas for improvement and facilitates data-driven decision-making that drive growth and propel success. However, technology services companies are inherently complex. They serve customers from multiple industries, employ a diverse mix of staff and contractors across various geographies, offer a wide range of services and solutions, and operate with multiple billing models. These factors make understanding true performance a significant challenge. While a broad spectrum of metrics can provide comprehensive insights, it’s crucial to choose wisely and focus on the most relevant indicators for your business goals. Some metrics may be more suited for SaaS or product companies, while others align better with services firms. Prioritizing the right metrics helps avoid being overwhelmed by a deluge of data that can distract from what truly matters. Measure what is important and directly impacts strategic objectives—no more, no less.
The biggest mistake companies make is starting with easily available metrics rather than those aligned with their business objectives. Aligning metrics with strategy requires strict prioritization. Moreover, focusing solely on financial metrics without considering operational or project-level data makes it difficult to gauge overall business performance. Many mid-sized technology service firms lack a metrics strategy and rely on their CFO and COO to drive it, resulting in a company dashboard that is primarily financial. Delivery and sales leaders track these complex metrics through a hectic monthly and quarterly process, yet they fail to understand how their daily activities are impacted. If you don’t have a formal metrics program or strategy laid out yet, you can start with the key business outcomes applicable to any services company – Growth, Efficiency, and Profitability. Begin by identifying the processes that directly influence these outcomes. It’s crucial to understand the stakeholders involved in each process and their respective interests before selecting relevant metrics. Then, determine specific metrics that indicate the performance of those critical processes – these will be your value levers for success. Consistently measure and monitor these metrics to gain insights into the drivers of growth, efficiency, and profitability. Let’s explore these outcomes and their related metrics in more detail. In addition to typical financial metrics from the balance sheet and income statement (such as revenue, COGS, SG&A, working capital, AR aging, AP liability, and fixed capital efficiency), you’ll want to track operational metrics tied to these key outcomes.
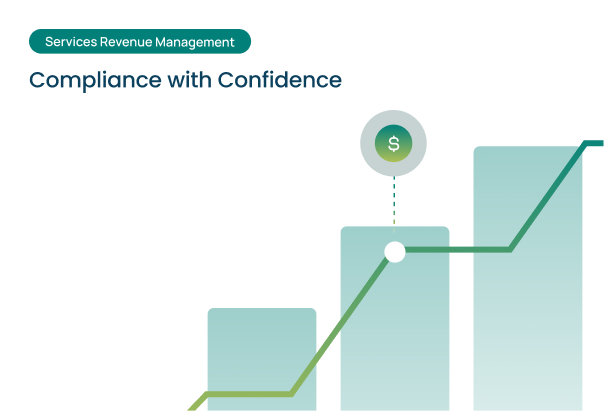
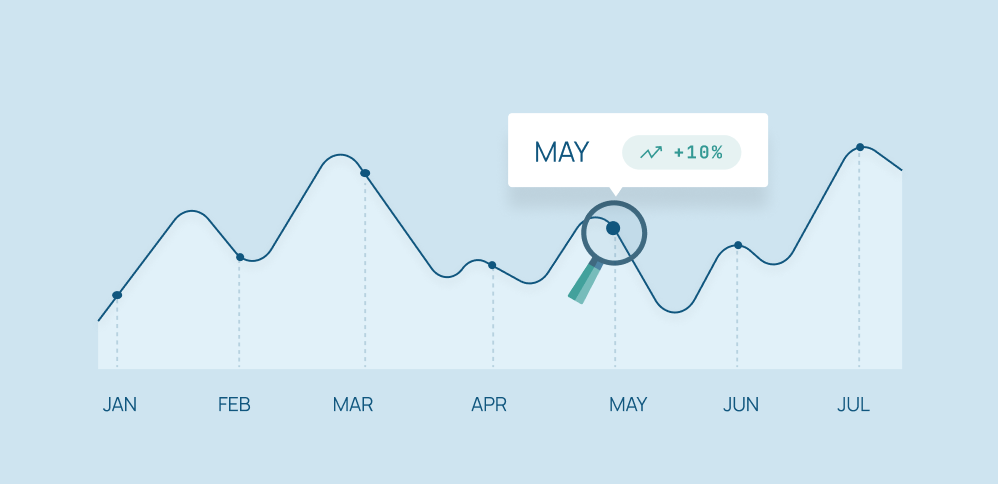
Revenue and customer acquisition are the lifeblood of any services business. Tracking metrics such as total revenue, growth rate, bookings trend, renewals, and customer acquisition cost provides a clear picture of a company’s ability to attract and retain clients. It also helps identify potential areas for improvement in sales and marketing strategies. Ideally, midsize technology services firms should aim for annual revenue growth of 20-30%. However, the health and sustainability of this growth depend on various other metrics.
QoR (Quality of Revenue): For service companies, high-quality revenue indicates that the business has more value-based pricing projects such as fixed fee, managed services, or outcome-based, rather than staffing or cost-plus engagements.
Recurring Revenue: Recurring revenue streams from long-term contracts or managed services offerings can provide greater stability and predictability, enabling better resource planning and forecasting.
Revenue Concentration: It’s crucial to monitor revenue concentration across different clients, industries, and service lines. An over-reliance on a small number of large clients or a single industry can lead to significant risks if those clients or industries experience downturns or shifts in demand.
RAR (Revenue at Risk): Services revenues are often tied to long-term contracts. Tracking RAR from pending sales orders, overallocated resources, contract expirations, renewals, or potential churn helps forecast future revenues and take proactive steps to mitigate risk.
RPP (Revenue Per Person): Keeping an eye on RPP is key to understanding pricing, utilization and productivity of your workforce. Higher RPP indicates more efficient staffing and resource management, driving profitability.
Customer Net Change: Acquiring new service customers is more costly than retaining existing ones. Monitoring new bookings vs losses highlights performance of sales, delivery, and customer success functions.
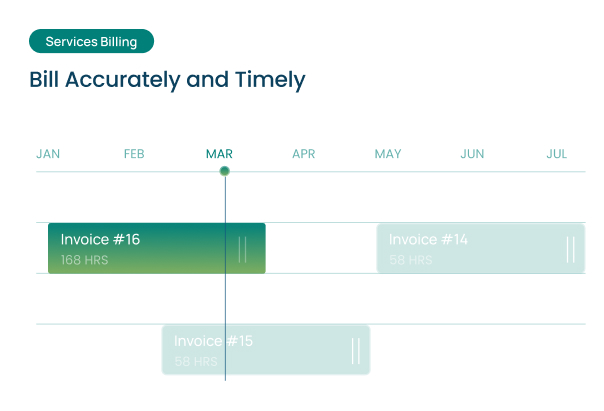
Average Bill Rate: This metric directly impacts margins and profits for services sold. Tracking bill rates ensures pricing stays aligned with value delivered and competitive positioning as labor costs fluctuate.
Sales Metrics: To drive growth, it’s essential to monitor metrics like average sales cycle length, lead conversion rates, and sales pipeline coverage to identify bottlenecks or inefficiencies in the sales process. Tracking metrics such as revenue per sales rep and average deal size can provide insights into the productivity and effectiveness of the sales team, helping to pinpoint areas for coaching, training, or
process improvements to enable more efficient and effective customer acquisition
Optimizing resource utilization and productivity is key to maximizing profitability. Metrics such as employee utilization rates, project completion times, and resource allocation efficiency can help identify bottlenecks, streamline processes, and ensure that resources are being effectively deployed.
Headcount Growth: Closely tracking employee headcount growth is critical for ensuring adequate resource capacity to support revenue growth and meet project demands, without over-hiring and impacting profitability. It helps with workforce planning and budgeting.
Onsite/Offshore Ratio: This ratio allows services firms to optimize their workforce mix by balancing lower-cost offshore resources with client-facing onsite personnel. Getting this ratio right is key to maximizing cost efficiencies while still delivering high-quality service and maintaining strong client relationships.
Employee Role Ratio: Understanding the balance of roles like managers, architects, developers, QA etc. ensures having the right skill mix and seniority levels to effectively staff and deliver client projects. Improper role ratios can lead to over/under utilization of resources and lower margins.
Utilization Rate: This indicates how effectively the full workforce is deployed on billable client projects versus being on the bench. Optimizing utilization is crucial for superior resource management and profit maximization.
Billable Utilization: Tracks the percentage of the workforce’s total time that is actually billed to clients for services rendered. This indicates revenue realization efficiency compared to workforce costs.
Available Capacity (Bench): While some bench is necessary for staffing flexibility, an excessive underutilized bench can severely impact profitability. Monitoring bench strength indicates potential to staff new projects. Mid-sized services firms keep 15-20% bench ideally so that they can fulfill new demand and avoid revenue leakages.
Employee Attrition Rate: High employee attrition can severely disrupt operations by leading to knowledge drain, impacting client delivery and satisfaction. Monitoring attrition highlights retention issues that need to be addressed through compensation, training, culture improvements etc.
Project Health Ratio: This metric tracks on-time/on-budget delivery, quality, and client satisfaction metrics across the services portfolio. Ensuring a high project health ratio is critical for client retention and revenue growth. Investment Utilization: Technology service firms must continually invest in training and R&D as well as for strategic client projects to upgrade capabilities. Monitoring investment hours ensures developing future skills for competitive differentiation and growth.
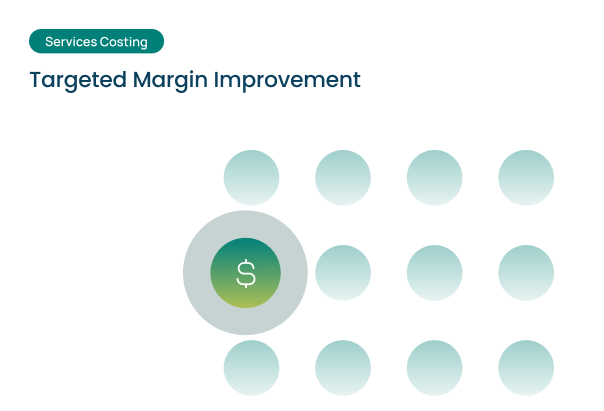
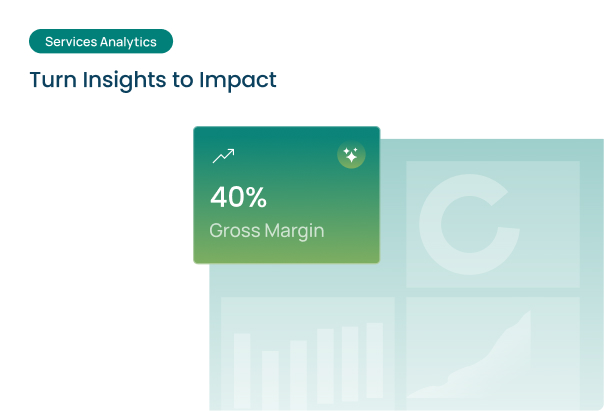
At the core of any successful business lies profitability. Monitoring metrics like gross profit margin, operating profit margin, and cost of goods sold (COGS) can shed light on areas where costs can be trimmed without compromising quality or customer satisfaction.
Gross Margins: Tracking gross margins is critical for understanding profitability at an overall business level. It indicates how efficiently services are being delivered after accounting for direct costs like employee wages and subcontractor spend.
Project Margins: Analyzing margins at the project level provides visibility into which engagements are most/least profitable. This allows prioritizing resources on high-margin client projects.
Customer Profitability: Understanding profitability by customer account is key, as some may be unprofitable due to low rates, high costs to serve, scope creep etc. This highlights where to renegotiate terms and focus.
CPP (Cost Per Person): Monitoring the fully loaded cost per employee/resource enables benchmarking efficiency across teams/locations and optimizing workforce planning.
Subcontractor Spend: For staffing flexibility, use of subcontractors is common but needs monitoring as uncontrolled spend can severely impact margins. Consider bringing them in-house for better control over your resource costs.
Available Capacity (Bench) Cost: While some bench is necessary, excessive underutilized bench capacity increases overhead costs, dragging down profitability. The right ratio is difficult to achieve, but not impossible.
Project Overrun Cost: Measuring cost overruns from delays, rework etc. on projects highlights execution issues and quantifies their financial impact. It can also help plan better for projects of the same nature in the future.
FTE vs CW Profitability: Comparing profitability of permanent vs contracted workforce informs decisions on the optimal employee/contractor mix. It affects long term hiring decisions and margins.
Supplier Margin Analysis: Reviewing margins across vendors/staffing suppliers ensures competitive pricing for high-quality services delivery. It can help you make tactical decisions for the future.
To gain deeper insights and identify potential issues or areas for improvement, it is essential to analyze each metric across various dimensions, such as customers, locations, types of offerings, project roles, employee levels or experiences, competencies, project types, billing types, and more. Breaking down the data by these different dimensions can uncover hidden patterns and highlight specific challenges or opportunities that may not be evident when viewing aggregate numbers. For example, analyzing revenue by customer types, locations, or service offerings can reveal which areas are performing well and which may need additional attention or resources. Similarly, examining costs or profitability metrics by billing types, projects or clients can help identify inefficiencies or opportunities for cost optimization.
Make sure you have access to accurate and timely data before you measure. Without the right technology to support your metrics strategy, it will eventually fail. Begin by measuring what you can, and evolve from there. Platforms like SuccessPro can simplify monitoring these metrics on a centralized dashboard, eliminating the need for complicated spreadsheets. Once you have identified areas of concern or potential improvement through your multi-dimensional analysis and right technology, it’s time to determine the appropriate course of action. This may involve adjusting pricing strategies, reallocating resources, implementing process improvements, or exploring cost-saving measures. Regularly reviewing and adjusting your strategies based on market dynamics and client feedback is crucial to remain competitive and maximize revenue potential. By keeping a finger on the pulse of these vital metrics, definitions, formulas, and rules of thumb, mid-sized technology service companies can confidently navigate the ever-changing industry landscape, optimizing operations for sustainable growth and profitability.
